应付课程需要
分类
通过已有训练集预测属性
算法:
- 决策树
- K-Nearest Neighbors
- 神经网络
- 支持向量机
数据分成两部分。一部分作为训练集用于生成模型,另一部分用于校验这个模型
混淆矩阵:预测真,实际真为真真;预测真,实际假为假真。类推。
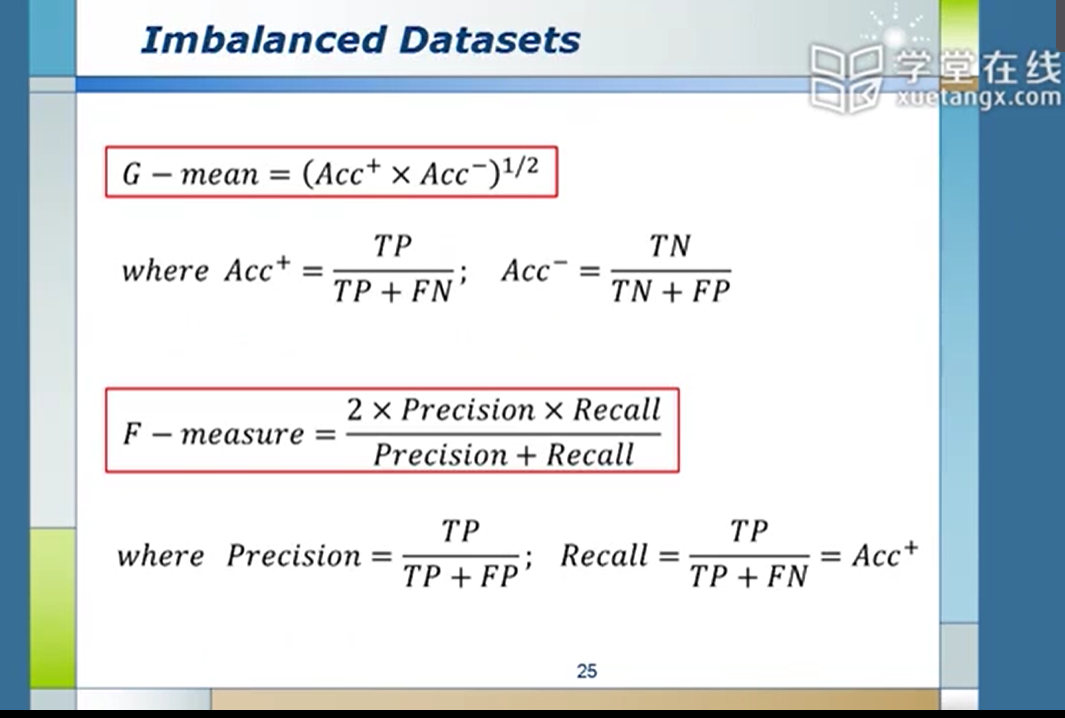
TPR=TP/(TP+FN) 真真率=真真/(真真+假假)
TNR=TN/(TN+FP) 真假率=真假/(真假+假真)
Accuracy=(TP+TN)/(P+N) (真真+真假)/(真+假)
ROC(Receiver Operating Characteristic)曲线
假真与假假,权重
Lift Analysis,依据潜在可能性高低划分群体 对应于撒网策略
聚类
将数据进行非标签化分组,只是依照基本属性如身高体重(也就是说靠数据之间本身存在的关联性将他们拉在一起)
距离度量:
- Euclidean DIstance
- Manhattan DIstance
- Mahalanobis Distance
算法:
- K-Means
- Sequential Leader
- Affinity Propagation
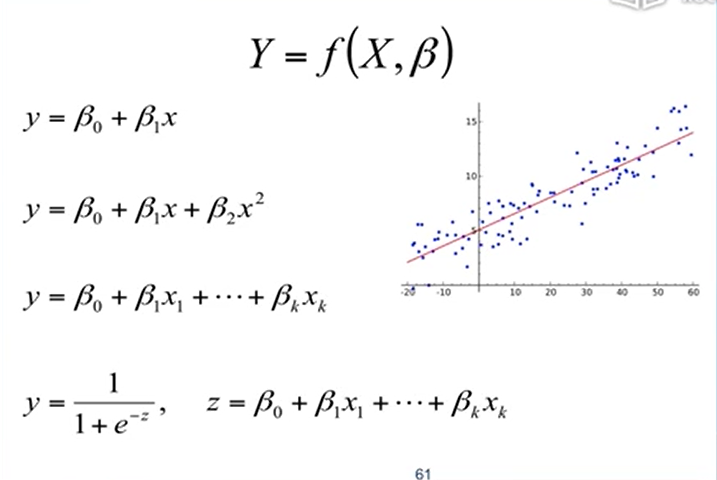
常见的线性回归
预处理
缺失
- 忽略
- 填:再采样。猜?固定值(均值、零啊什么的
离群点,异常点
标准化
有明确上下界
v' = (v - min) / (max - min) * (new_max - new_min) + new_min
无明确上下界
v' = (v - u) / a (u均值,a标准差)
数据描述
平均数、中位数、众数、方差
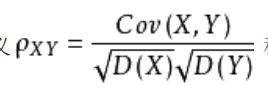
相关系数
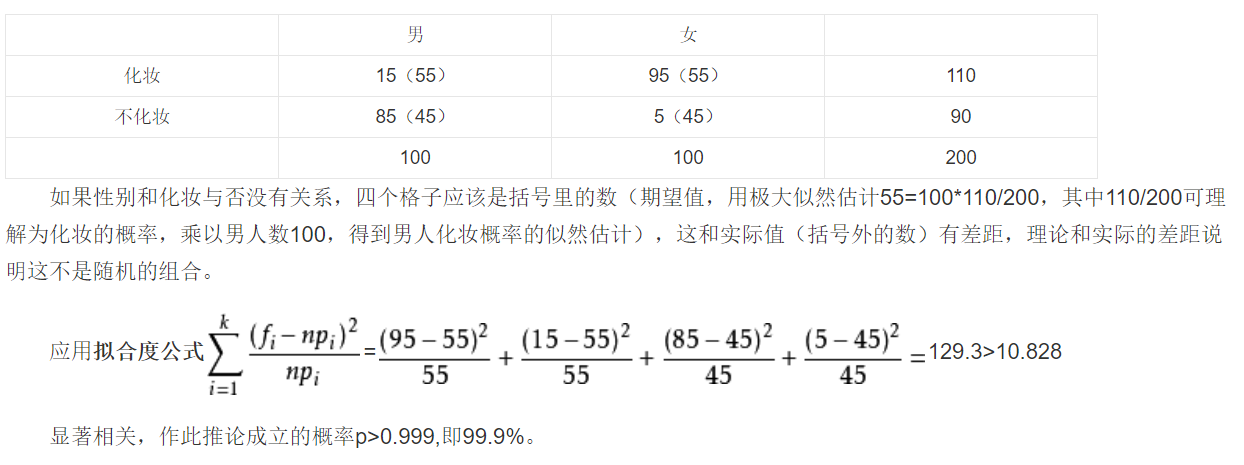
卡方检验
准确率
属性选择
量化 Entropy 熵 描述不确定性
\(H(X) = -\sum_{t=1}^m p(x_i)\log_b p(x_i)\) 分支定界 选择最优属性组合
对属性进行打分,利用子节点分数单调递减的特性进行搜索剪枝
主成分分析(PCA)
对指标变量矩阵进行主成分分析。
from sklearn.decomposition import PCA
model = PCA()
model.fit(D) //D为要进行主成分分析的数据矩阵
model.components_ //特征向量
model.explained_variance_ratio_ //各个属性的贡献率
线性判别分析 LAD(Linear Discriminant Analysis)
选择合适的投影方向减少重叠
机器学习分类
- 监督式学习(希望趋向一个正确答案
- 回归分析
- 使用一组已知对应值得数据产生的模型,预测新数据的对应值
- 如 股价预测
- 分类问题
- 根据已知标签的训练数据集,产生一个新的模型,用以预测测试数据集的标签
- 如 客户流失分析
- 回归分析
- 非监督式学习(找到一个可能的答案
- 减低维度
- 产生一有最大变异数的字段线性组合,可用来减低原本问题的维度与复杂度
- 浓缩用到的特征,形成一个新指标
- 聚类问题
- 客户分层
- 减低维度
回归分析
简单线性回归
\[y = \beta_1x + \beta_0\]使用scikit-learn进行预测
| index | year | salary |
|---|---|---|
| 0 | xxx | xxx |
| 1 | xxx | xxx |
| 2 | xxx | xxx |
# 引入数据
X = df[['year']]
Y = df['salary']
# 引入模型
from sklearn.linear_model import LinearRegression
regr = LinearRegression()
regr.fit(X, Y)
# 绘图
print('Coefficients=', regr.coef_)
print("Intercept=", regr.intercept_)

plt.scatter(X, Y, color="black")
plt.plot(X, regr.predict(X), color='blue', linewidth=3) #这里X同时作为了训练集和验证集,不对头
plt.show()
一元二次线性回归
\[y = \beta_2x^2 + \beta_1x + \beta_0\]# 引入模型
from sklearn.linear_model import LinearRegression
from sklearn.preprocessing import PolynomialFeatures
poly_reg = PolynomialFeatures(degree=2)
X_ = poly_reg.fit_transform(X)
regr = LinearRegression()
regr.fit(X_, Y)
X2 = X.sort_values(['year'])
X2_ = poly_reg.fit_transform(X2)
# 绘制
plt.scatter(X, Y, color="black")
plt.plot(X2, regr.predict(X2_), color='blue', linewidth=3)
多元线性回归
\[y = \beta_1x_1 + \beta_2x_2 + ... ?\]| home | price | SqFt | bedroom | bathroom | offers | Brick | Neighborhood |
|---|---|---|---|---|---|---|---|
| 1 | 12345 | 1212 | 2 | 2 | 2 | No | East |
| 2 | 12345 | 1212 | 1 | 1 | 1 | Yes | West(North) |
转换非数值数据
house = pandas.concat([df, pandas.get_dummies(df['brick']), pandas.get_dummies(df['neighborhood'])], axis=1)
# 避免Dummy Trap
del house['No']
del house['West']
# 删除无用值
del house['brick']
del house['neighborhood']
del house['home']
建立模型
# 引入模型
from sklearn.linear_model import LinearRegression
regr = LinearRegression()

X = house[['SqFt', 'bedroom', 'bathroom', 'offers', 'Yes', 'East', 'North']]
Y = house['Price'].values

regr.fit(X, Y)
regr.predict(X)
模型验证
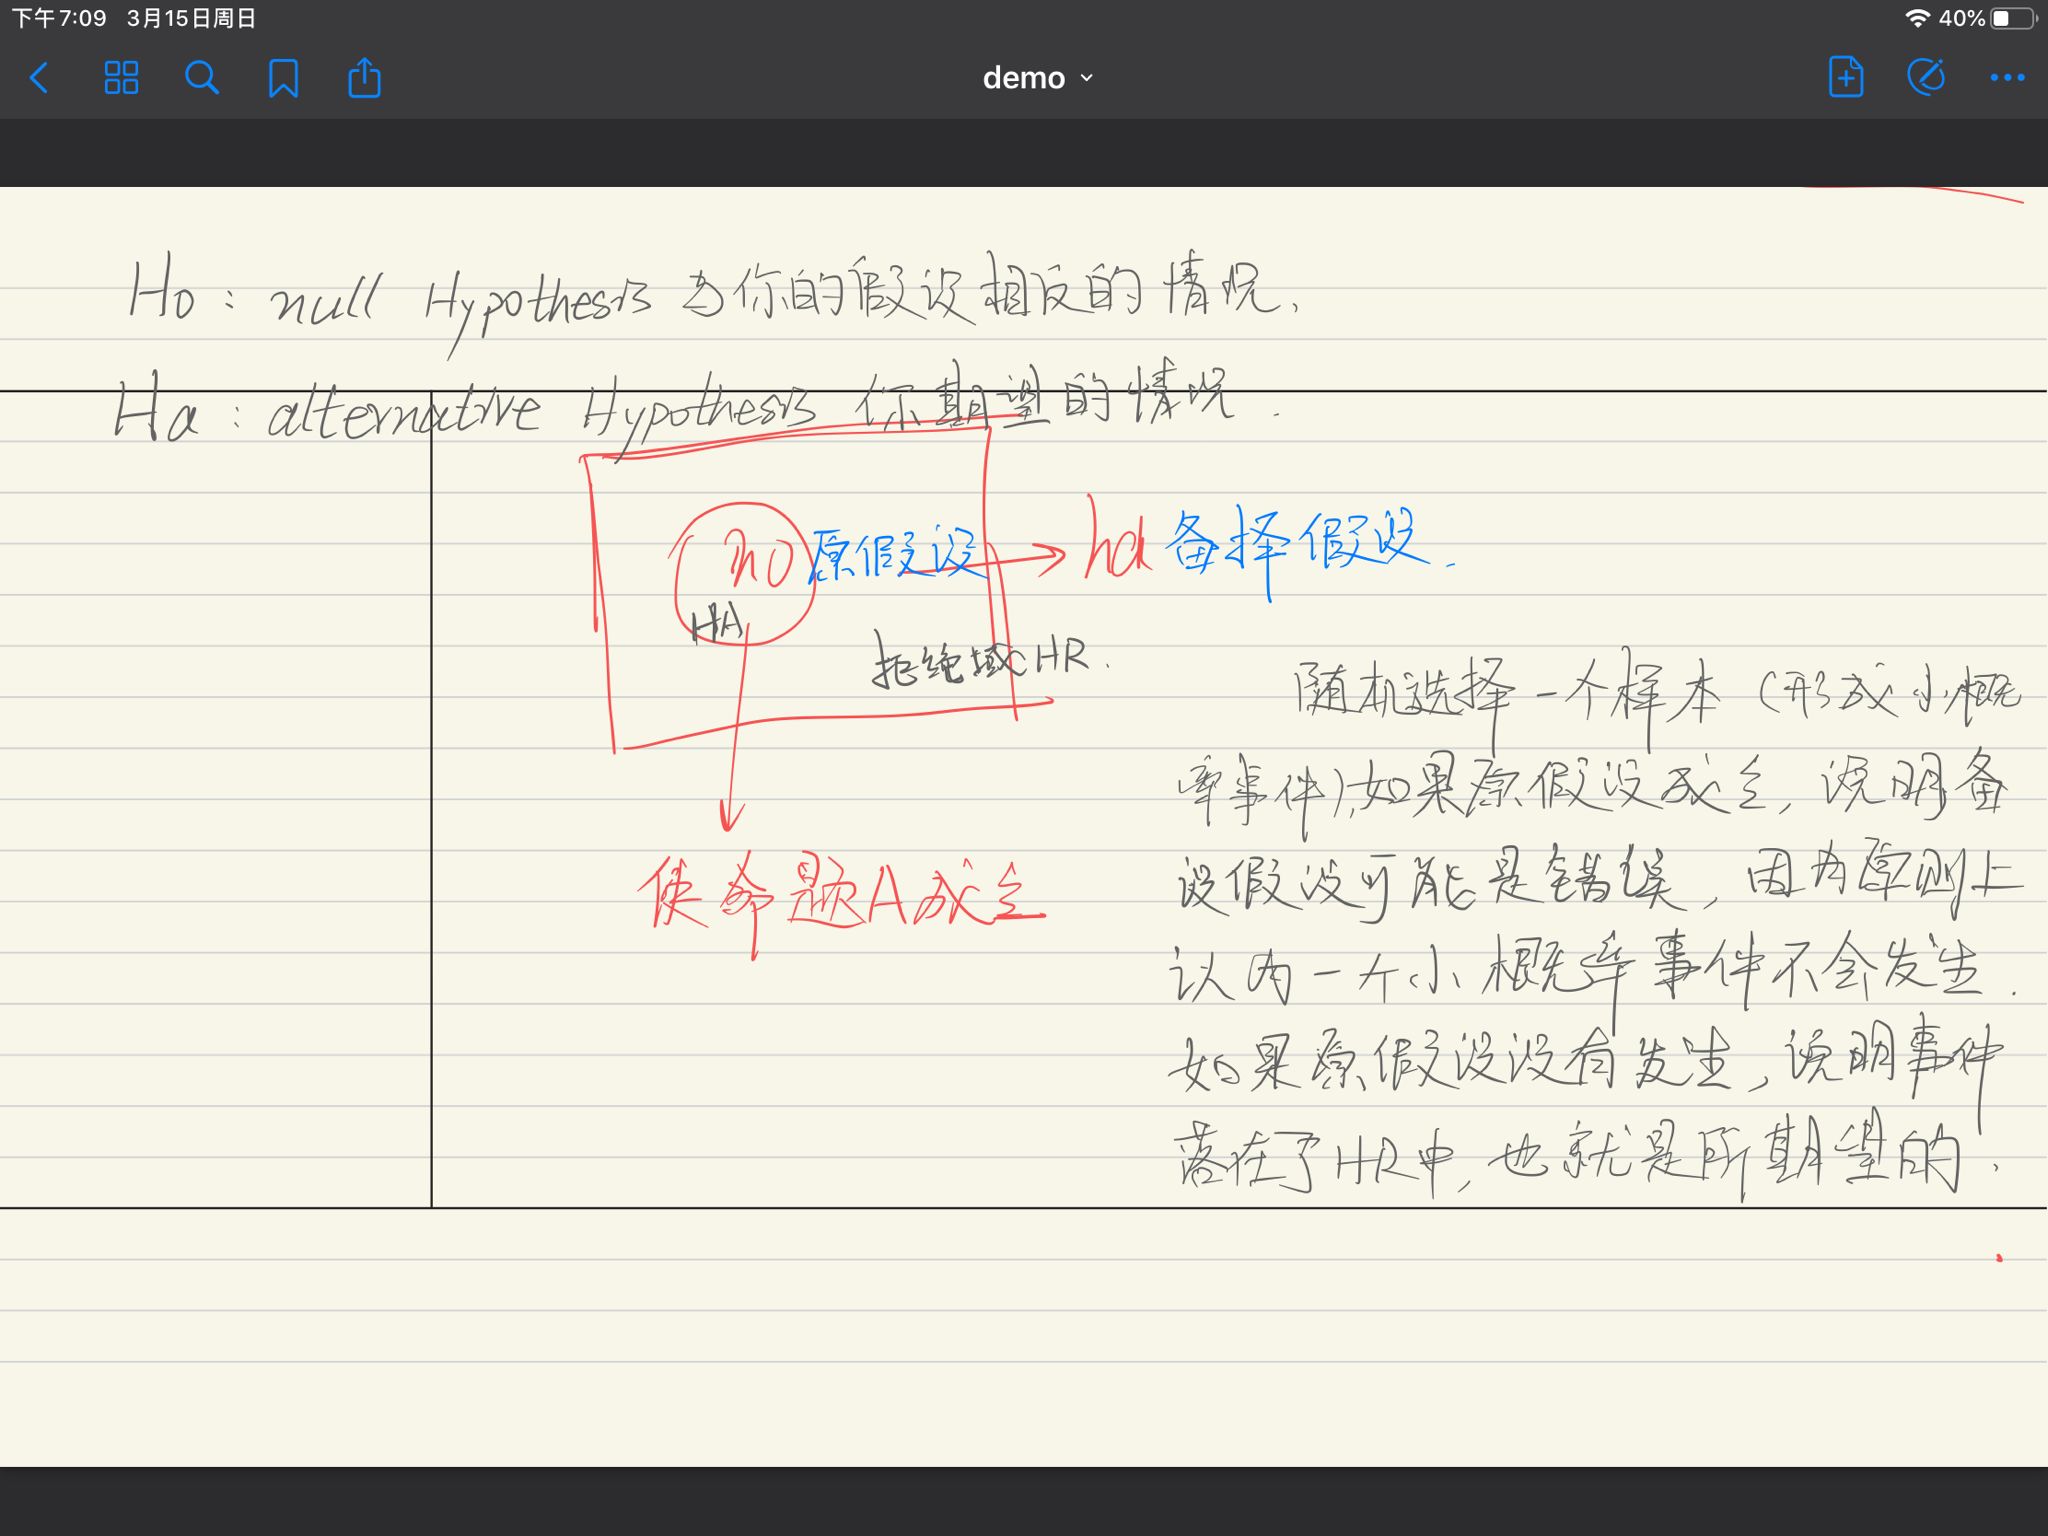
原假设(基于小概率事件的反证法)
# 数据沿用上节
import statsmodels.api as sm
X2 = sm.add_constant(X)
est = sm.OLS(Y, X2)
est2 = est.fit()
print(est2.summary())
输出解释:
coef回归系数std err标准偏差t当原假设成立时的tP>|t|t发生时的概率95.0% Conf95%置信估计
通常为了检验自变量与因变量是相关的,则需要推翻无关,即验证无关是小概率事件
模型检验
-
如 检验简单回归模型
- 检验模型是否匹配数据
- 检验每个自变量是否都为显著
-
F统计
- 回归平方平均
- 误差平方平均
- F统计
-
R-Square
- 比较好的预测精确度指标
- 残差平方和(减自己预测的结果)
- 整体平方和
- R-Squa red
- 期望接近于1
- Adjusted R Square 引入惩罚机制,防止无限制的增加变量来增大R Square
-
AIC & BIC
- \[AIC = 2k + n \ln(\dfrac{SSE}{n})\]
-
k是参数的数量,n为观察数
- AIC鼓励数据拟合的优良性但是尽量避免出现过度拟合。所以优先考虑的模型应该是AIC值最小的那一个。赤池信息量准则的方法是寻找可以最好地解释数据但包含最少自由参数的模型
stepAIC
# 对所有的自变量组合进行AIC计算
predictorcols = X.columns

import itertools
AICs={}
for k in range(1, len(predictorcols)+1): #前闭后开
	for variables in itertools.combinations(predictorcols, k):
        predictors = X[list(variables)]
        predictors2 = sm.add_constant(perdictors)
        est = sm.OLS(Y, predictors2)
        res = est.fit()
        AICs[variables] = res.aic


from collections import Counter
c = Counter(AICs)
c.most_common()[::-10]
PREVIOUSNFS搭建
NEXTLeetcode - 双指针